Regular readers of these pages know that Boxwood is a big booster for small cap CRE, Main Street businesses, and the lenders that support the viability and growth of small enterprises. With our long-standing focus on small cap CRE property valuations and research, our team has organically gained a deep appreciation of the distinctive characteristics, performance, and trends within this massive CRE space.
At this juncture, we see a widening performance gap between small and large cap CRE markets that couldn’t be more revealing or stark.
×
![]()
The fact is that when Main Street businesses thrive, a prime beneficiary is small cap CRE, e.g., our local retailers and neighborhood strip centers, light industrial users, conveniently located, suburban office buildings, etc. These days small businesses are generally prospering in part because of solid growth in the U.S economy. Indeed, a majority of small businesses reported to be in good health and financial condition according to the latest MetLife/U.S. Chamber of Commerce survey.
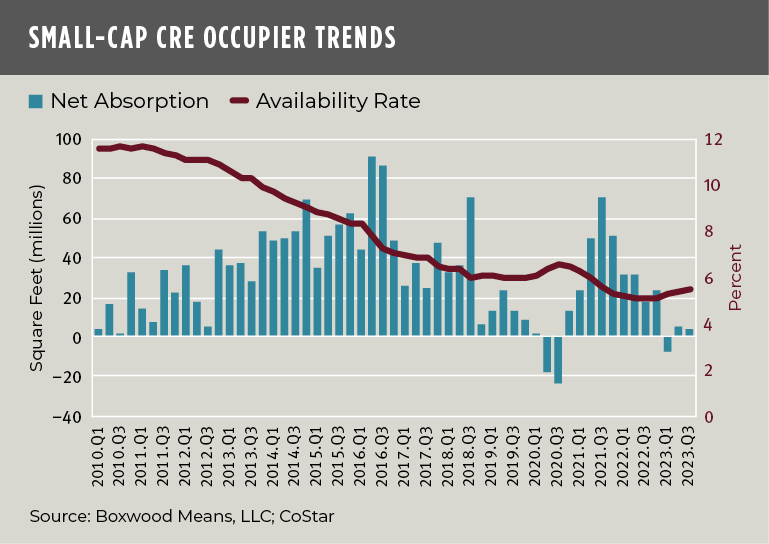
This Main Street well-being has trickled down to small cap CRE fundamentals. As described in my report last week, U.S. occupier trends across small cap retail, industrial, and office sectors were in much better shape than the overall CRE market through the first three quarters of this year. As shown in the nearby graph, demand fundamentals of the three small domain sectors combined paint a picture of market stability, if not modest growth during a period of extensive debate and uncertainty about the health and direction of commercial real estate at large.
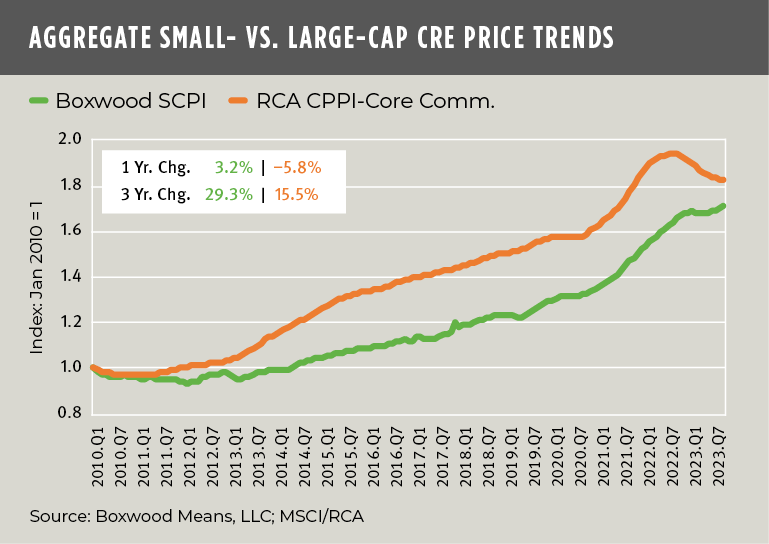
But the chief takeaway from these trends is the resultant, steady property-level NOI and resilient asset valuations that are typically produced for small-time owners and investors. And here is where it then gets interesting and especially meaningful: i.e., because small cap assets have substantially outperformed large caps in terms of price growth as shown in the next two charts.
×
![]()
In the first graph, we show the comparison between Boxwood’s Small Commercial Price Index (SCPI) that tracks asset sales under $5 million and MSCI/RCA’s CPPI-Core Commercial Index covering large caps principally above $2.5 million. As depicted by the orange trend line, large cap asset prices bent over in mid-2022 and, with a loss of 5.8% over 12 months ending July, have yet to stabilize. By contrast, Boxwood’s SCPI, whose positive growth trajectory generally kept pace with large caps after the pandemic abated, gained 3.2% in a year’s time and, with a hefty 29.3% increase over three years, nearly doubled the return of large caps.
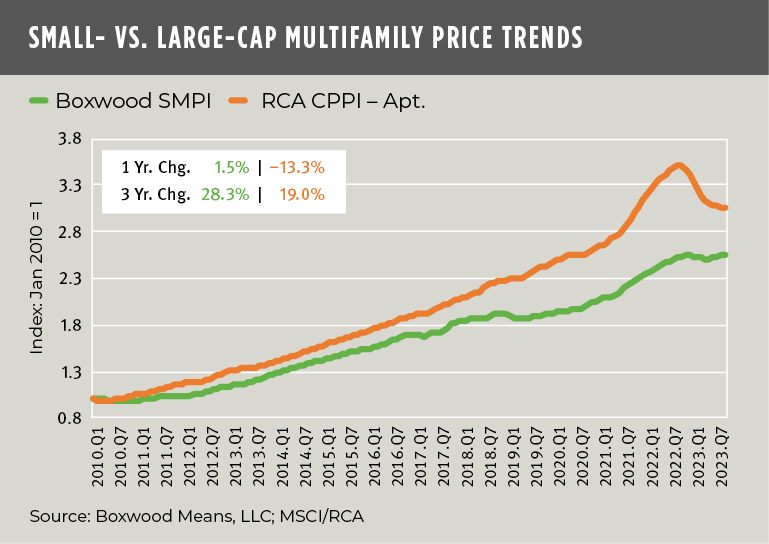
Multifamily price performance tells a similar story. As shown in the third graph, large cap multifamily asset prices, weakened by reported pressure on rents due to an expansion in supply, lost a notable 13.3% over 12 months according to MSCI/RCA data. On the other hand, the notoriously supply-constrained small cap multifamily market produced a 1.5% gain YOY and, moreover, far outdistanced large cap multifamily price increases over three years with a 28.3% return based on Boxwood’s Small Multifamily Price Index (SMPI).
×
![]()
Granted, there is a lot of opacity surrounding the outlook for CRE asset prices and, furthermore, the uncertainties about capital costs and the economy in general may yet quash similar gains in the future. Yet, what is clear is that small cap CRE, harnessed to the fortunes of small business, has so far delivered enviable price growth for lenders and investors while beating the rest of the market.


 Randy Fuchs


