×
![]()
With recession fears abating in the waning months of 2019, the CRE market will register a record tenth year of expansion. National small-cap CRE asset prices have increased substantially over the cycle and have recovered much - though not all - of their losses incurred during the financial crisis. In fact, it's very possible that certain regions and constituent cities will fall short of a full price recovery during the current cycle. After all, the mid-2000's run-up in both residential and commercial real estate prices reflected a bubble with unsustainably high property values.
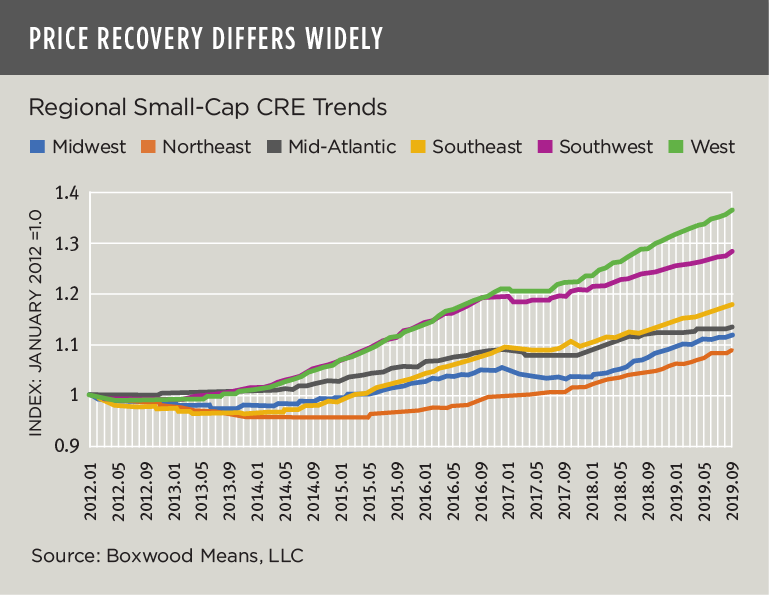
In the wake of the financial crisis, the rising tide of the U.S. economy proverbially lifted all boats to some extent, but not all small-cap CRE markets have equally re-inflated along with it. Indeed, since the onset of recovery in 2012 there have been wide variances in asset price trajectories across U.S. regions according to our latest research. See the nearby graph showing clear leaders and laggards. A brief outline of each region's performance follows.
The West region has posted the best price gains by far. Powered in part by strong job growth in STEM-related businesses in San Jose, San Francisco and Seattle among other metros, the West has enjoyed a hefty 4.1% compound annual growth rate in small-cap CRE prices since bottoming out in 2012. With this robust growth, the West has recovered 68.7% of its losses through September but, as a result of a severe decline in prices in the wake of the financial crisis1, this region remains 11.1% below its former boom-time peak value at the end of 2007.
Driven by growth in energy-patch markets including Houston, Tulsa and Oklahoma City, and also pumped up by the fast-paced employment and population advances in Denver, Dallas and elsewhere, the Southwest was runner-up to the West with enviable 3.3% annual price growth. Having retraced 69.1% of the region’s cyclical losses, the Southwest was 9.2% below its former apex as of September's reading.
As the comparative trends also show, the Midwest and Northeast have witnessed the slowest rising reflation in prices during the upcycle. With its high concentration of traditional manufacturing sectors and factory employment that has yet to fully recover since the Great Recession according to BLS, the Midwest's small CRE asset prices have increased at a modest 1.5% annual growth rate leaving in its wake a 14.4% deficit to a breakeven point with its past peak value.
The former peak-to-current change in the Northeast, at -8.9%, is the second closest to breakeven among the regions, though the area has reclaimed only 55.4% of its losses since 2012. The area's subpar annual price growth of 1.1% – the weakest of the group – explains the sluggish price rise despite positive contributions from prosperous hubs like New York and Boston. The fact is that among the 22 NY, NJ and CT metros comprising the Northeast, the region's overall employment growth has barely recouped its total job losses since the financial crisis.
The Mid-Atlantic states comprising PA, MD, WV, VA and the Washington, DC Metroplex reflect a broad array of private, public and government-related businesses that, in the context of aggregated small-cap CRE prices, has generated modest returns with low price fluctuation. That is, the Mid-Atlantic region has produced a fourth best 1.7% annual price gain coupled with the lowest annual price volatility (0.21%)2. As a result, the region has climbed to within 5.0% of its former peak level and recovered 69.8% of its losses – both tops among the six regions.
×
![]()
Forty percent of the more than 40 metro areas included in Boxwood's coverage of the Southeast region are clustered in Florida3. As many readers know, Florida is prone to housing boom and bust cycles, and was an epicenter of the housing crash that sent residential real estate values plummeting by 50% peak-to-trough according to Corelogic data4. The fallout from the housing crisis, in turn, rippled through the small-cap CRE domain causing sizable losses in commercial property values across Florida's cities and elsewhere. At its boom-era peak in late 2007, the Southeast's aggregate small-cap CRE price level was tops among all U.S. regions. The region's small-cap property values then plunged more than 60% – the largest drop among the group – before beginning a delayed recovery in 2013. Yet despite favorable annual price growth of 2.2% prompted by the region’s surge of in-migration and continued transition from traditional to knowledge-based and business-friendly economies, the Southeast had reclaimed only 35.6% of its valuation losses resulting in the widest gap (25.2%) to full recovery.
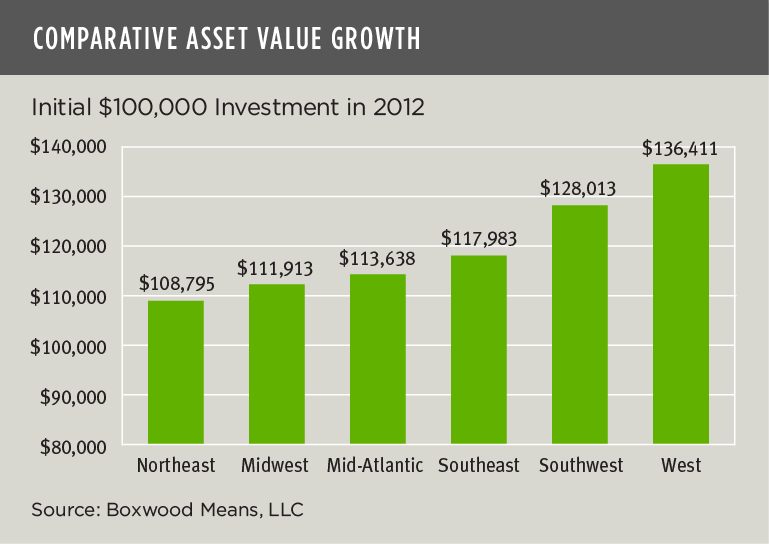
To summarize the varying property price performance among these regions over time, we can translate the payoff into dollar terms of, e.g., an initial $100,000 investment in each broad area. The nearby graph indicates that the West yields the highest return ($136,411) and the Northeast the lowest ($108,795).While this exercise oversimplifies the variable returns within any region, it highlights the importance of assessing price growth and appreciation potential for assets in different parts of the country.
It might be somewhat impractical or unrealistic to gauge metro and regional price performance based in part on the degree to which a market has regained parity with its peak value before the financial crisis. That said, knowing the ultimate boundary lines between feast and famine, or where current and projected property values sit between an era's peak and trough, are valuable guideposts in framing an investment thesis or financing for your next small-balance loan or property acquisition.