×
![]()
It's been almost 10 years since the end of the Great Recession, but it may be surprising that small-cap CRE asset prices have not fully reset across all U.S. metro areas.
Small-cap CRE prices bottomed out in January 2012 according to Boxwood's National Small Commercial Price Index (SCPI)1 and, with a solid 4.3% annual gain in 2018, SCPI surpassed its previous peak level by 3.0%. Indeed, 2018 was a solid year for small-cap CRE price appreciation as 90 of 125 markets in Boxwood's tracking universe produced YoY price growth of 2% or more.
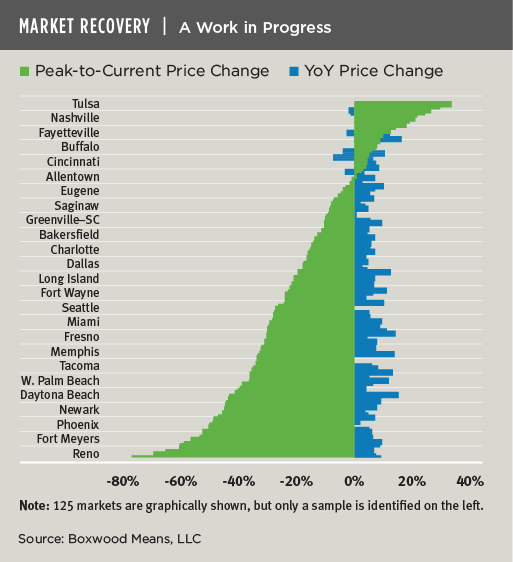
But as the nearby graph shows, nearly 100 of the metros were still underwater as of last December compared with their price levels prior to the Great Recession. (Note: the labeled metros are a mere subset of the data displayed.)
With so many of these markets still way below their former pre-crisis zenith (i.e., peak-to-current price change on the graph), the silver lining is that asset valuations in many of these smaller markets remain quite reasonable in a historical context. As such, many of these metros may represent attractive underwriting and acquisition candidates this year. Of course, small-balance lenders and investors know that the local economic context matters, too, so places hobbled by low metro GDP growth2, e.g., Toledo (-0.6%), Mobile (-0. 2%), Albuquerque (0.06%) and Fort Myers (1.5%) - where small-cap CRE prices are still 40% or more below previous peak levels – pose higher than normal investment risk. On the other hand, other metros that nose-dived but have since rebounded with GDP growth substantially above the national average like Reno (5.6%) and Palm Bay-Melbourne (4.7%) may be safer bets.
The point is that while the market's long expansion has generally lifted markets - and some to new heights3 - asset prices in a lot of metros are still struggling to regain lost ground. This is a striking legacy of the widespread havoc inflicted by the great financial crisis. Moreover, the lingering asset devaluation also strongly suggests that, given the protracted current cycle, price recovery for many secondary and tertiary markets may ultimately fall short of previous high-water marks this time around.