×
![]()
The pandemic-induced economic slump and the Great Recession have little in common. The latter arose from a financial crisis while the former is a sudden economic calamity threatening the solvency of small businesses nationwide. Main Street businesses are the pillars that support the nation's massive small commercial property market. Now that most business leaders and policy makers concede that a sharp V-shaped rebound will no longer take place, the devastating impact that widespread shuttering of small businesses will have on small-cap CRE owners, lenders and investors cannot be understated.
It cannot be measured yet, either. But as the number of sales transactions dwindle, tenant occupancies and rent revenue recede, and asset valuations grow more challenging, it's clear the toll will be substantial1. So it is instructive to take a deep dive into the contours of price decline and recovery stemming from the 2008-2009 recession as a benchmark for small-balance lenders and investors to consider in light of substantial downside risk associated with future loan performance and small-cap CRE asset prices.
In a new analysis of Boxwood's Small Commercial Price Index (SCPI) data, we calculated sales price trajectories for small commercial properties under $5 million in value through the recent real estate cycle. In addition, we completed a similar longitudinal analysis of Boxwood's Small Multifamily Price Index (SMPI). Our emphasis was on the fall from prior peak price levels and subsequent recovery through February of this year2. Below are the key takeaways for each sector.
Small-Cap Commercial Metros:
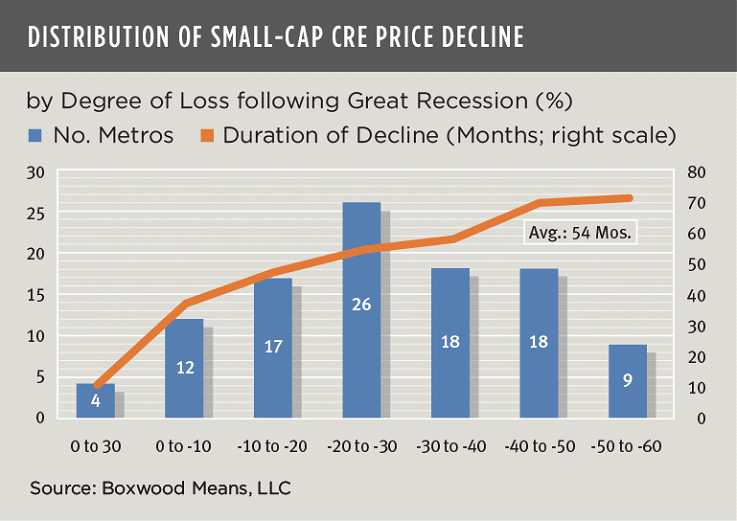
- The weighted average national price decline from pre-2009 peak to trough was 28%. More than 40% of the metros in the study suffered heavy losses between 30% to 60%. See the nearby graph.
- The average duration of decline to the nadir across all metros was 54 months, or 4½ years.
- The weighted average annualized rate of decline was 8.0%. Metro areas where asset values fell most precipitously from the previous peak included Sarasota-Bradenton (by 77%), and Modesto and Melbourne-Titusville-Palm Bay (66%).
- The weighted average annualized rate of price recovery was 2.0%.
- Rates of recovery varied widely. Only 33 metro areas, or 32% of the total, have surpassed their pre-2009 peak level including Greeley (151%), Scranton-Wilkes Barre-Hazelton (133%) and Tulsa (131%). By contrast, many have retraced only a modest percentage of their former peak level, led by three Florida laggards: Sarasota-Bradenton (32%), Melbourne-Titusville-Palm Bay (43%) and Fort Myers-Cape Coral (44%).

×
![]()
Small-Cap Multifamily Metros:
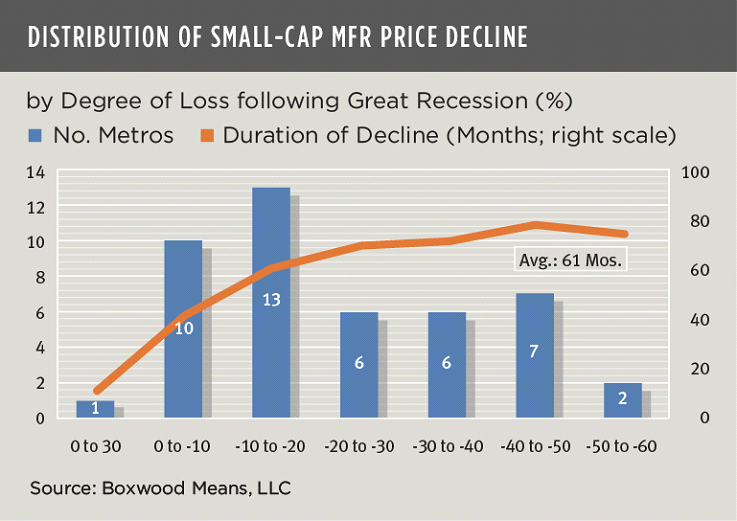
- The weighted average national price decline from pre-2009 peak to trough was 24%. One third of the metros in the study suffered losses between 30% to 60%. See the nearby graph.
- The average duration of decline to trough was 61 months, or roughly 5 years.
- The weighted average annualized rate of decline was 5.1%. The largest post-peak losses were again concentrated in Florida including Fort Lauderdale (by 58%), West Palm Beach-Boca Raton (53%) and Tampa-St. Petersburg-Clearwater (49%).
- The weighted average annualized rate of price recovery was 4.1%. New York posted the best annualized growth rate at a whopping 7.1% followed by Denver (6.6%) and Seattle-Bellevue-Everett (6.3%).
- Most multifamily markets (87%) have surpassed their pre-recession peak with impressive gains including San Jose (200.2%), and Portland-Vancouver-OR-WA and Seattle-Bellevue-Everett (190.0%).
The differences between rates of decline and recovery following the Great Recession are a possible clue to the trajectory of small-cap CRE markets and asset valuations going forward. As the past financial crisis unfolded, asset prices fell at a faster rate than their eventual pace of recovery years later. In fact, our study indicated a slightly negative correlation (-.22) between price deflation and inflation. That is, metro areas that fell the hardest were more likely to rebound more slowly.
Our findings also showed that once small-cap multifamily assets hit bottom, prices for these relatively more stable assets advanced at double the rate of small-cap commercial properties. In addition, the multifamily variance of 100 basis points between rates of price decline and later growth was modest compared with the more than 500-basis point difference for riskier small commercial properties.
These statistics remind us that our future recovery will likely be uneven and follow a similar restoration patterned after other national downturns: i.e., some property types will clearly outperform; also, growth will be sluggish over a period of years in some metro areas and more vigorous in others. For example, metros heavily dependent on tourism and entertainment, and areas sustained by oil and gas industries, may face a long road back. Other cities with high concentrations of STEM-related jobs will likely bounce back faster.
It is sobering that the pandemic may cause a second economic and CRE contraction of substantial magnitude within a decade. The key to a national revival that follows any distinct shape or form is a united front to stop future outbreaks and uphold safety above all.
See these pages for future updates on small-cap CRE price movements during the pandemic.


 Randy Fuchs

